Scroll below the map key for more information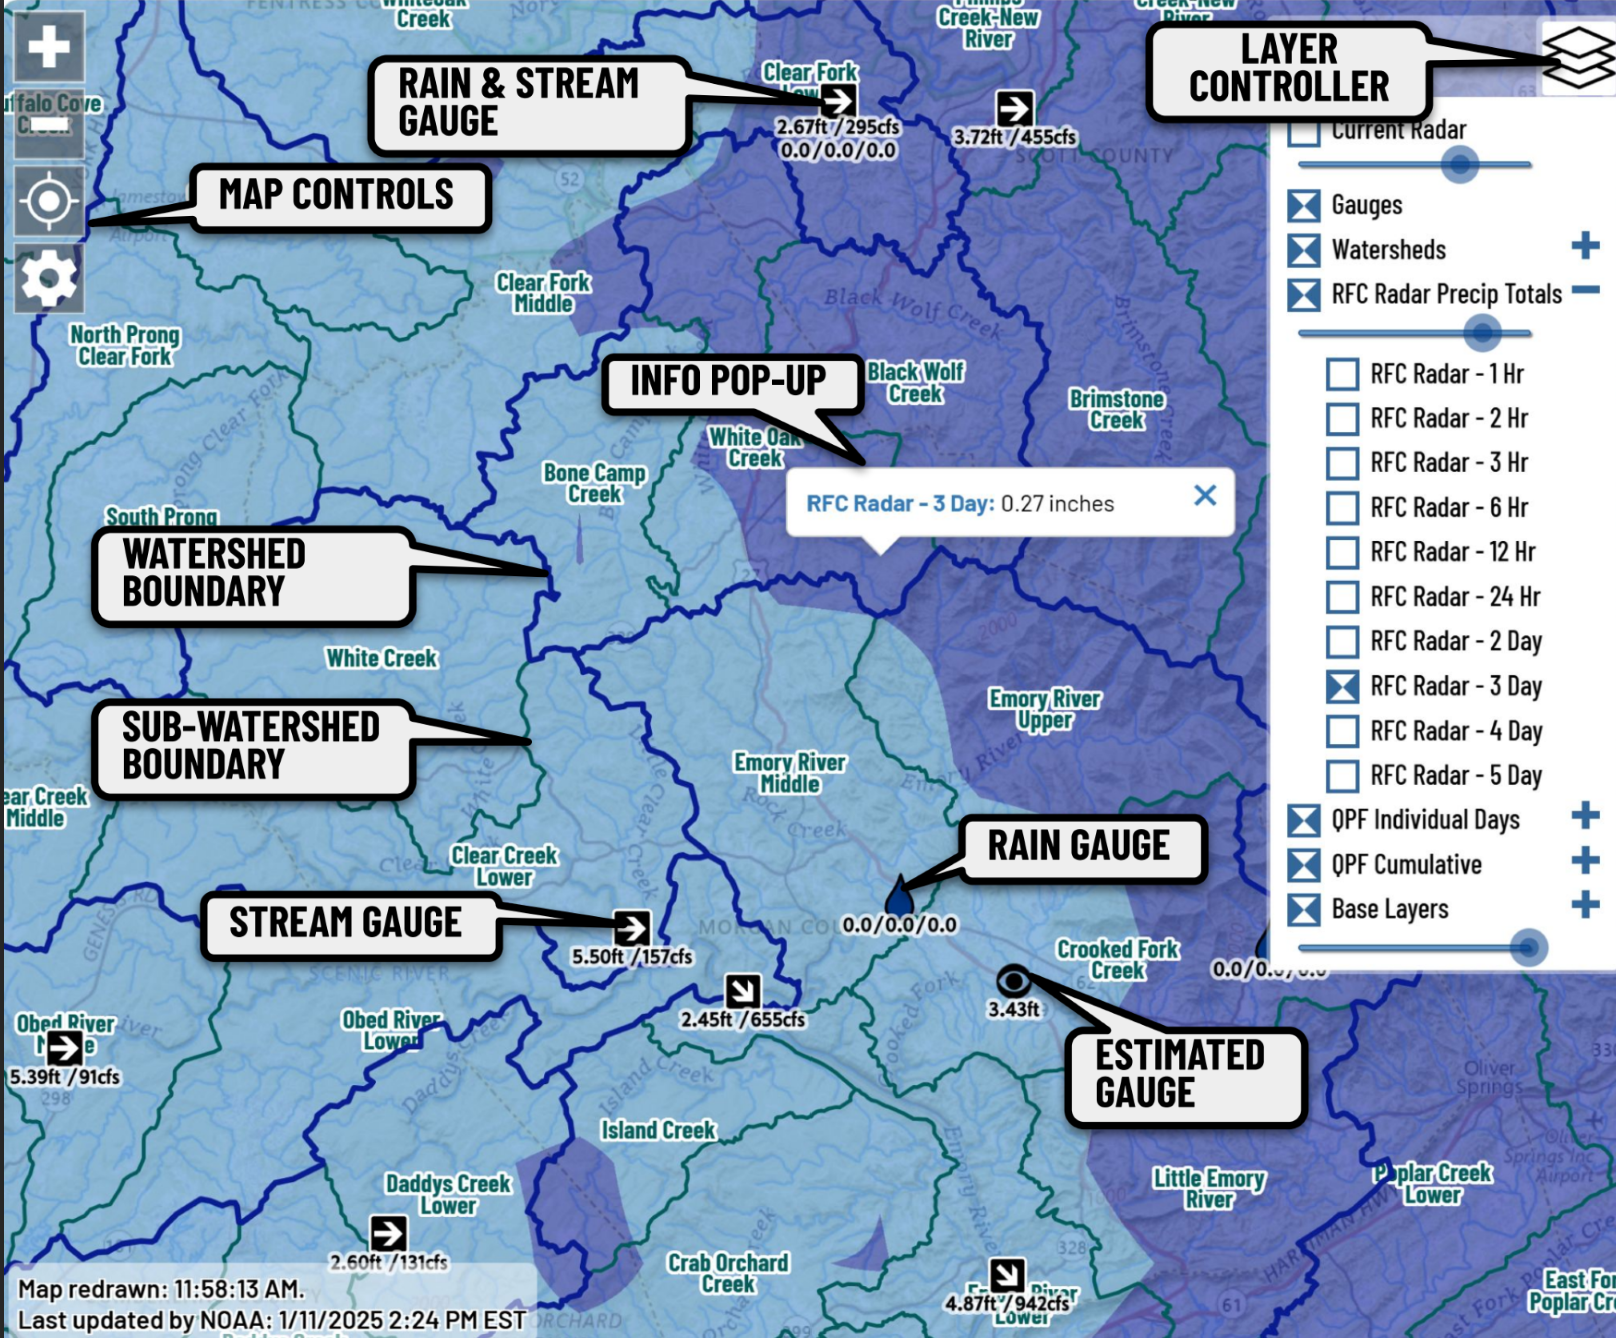
LAYER CONTROLLER
Click blue layers icon to open and close the Layer Controller, which gives you the ability to turn individual layers on and off. Some layers are grouped together; use the + and - controls to expand and collapse these groups. The round blue controls allow you to adjust the opacity/transparancy of the radar overlays. More information about the actual map layers can be found on the Map Layers page.
MAP NAVIGATION
Drag in any direction to move/pan the map. Use the + and - buttons in the top left corner zoom in and out. On touch devices, you can also use spread and pinch to zoom in and out. On desktops/laptops, you can hold the hold down the shift key and drag a box with the mouse to zoom into a specific area of the map.
CLICK THE MAP FOR MORE INFORMATION
Click/tap the gauges to get detailed information about each gauge. Then click the blue link in the pop up to view more details and a graph, as shown below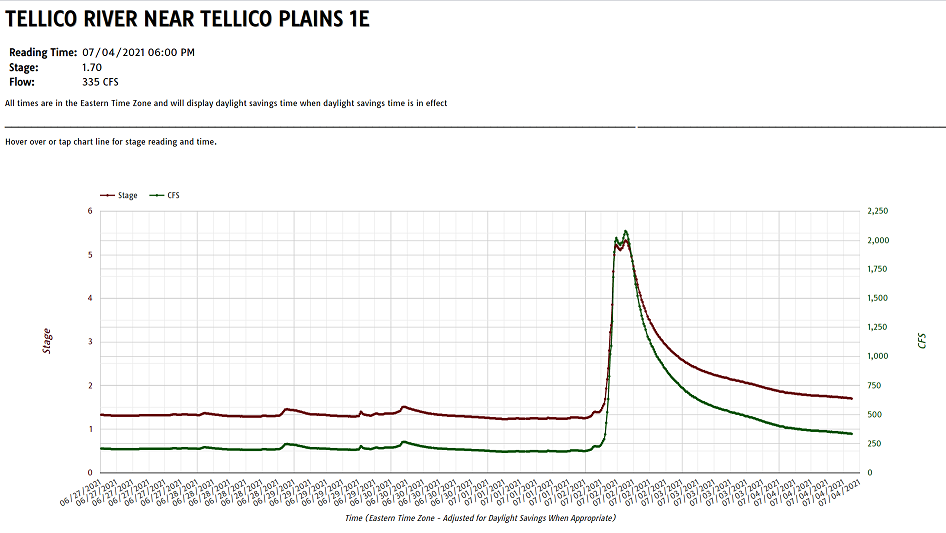
You can also click the any of the Radar Accumulation or QPF (Quantitative Precipitation Forecast) layers to see the amount of rain for that location: 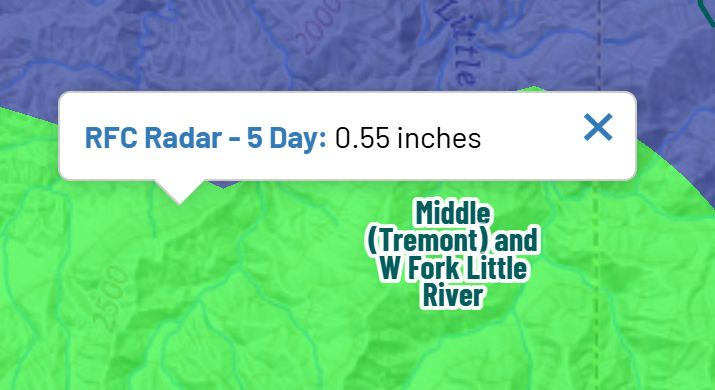
CUSTOMIZING THE DEFAULT MAP SETTINGS
Do you think that the RFC rainfall overlays are not transparent enough and have to adjust their transparency every time that you open the map? Do you live in NE ‘Bama and rarely care what’s going on in WV? Now you can adjust the default RainPursuit Map settings so you don’t have to make these adjustments every time the map opens.
What you should know
Your map settings are stored in “local storage”, which is like a small database that your browser stores on your device’s hard drive or its internal storage. Local storage is kinda like cookies. This means that you’ll have to save your map settings on every device that you use and in each browser if you use more than one. This also means that you may have to reset your settings if you clear or delete your browsing history. Most modern browsers support local storage and those that do are listed here.
Launch the Settings Pane
Launch the settings pane by clicking/tapping the gear icon near the top left corner of the map.
Layer Visibility
A number of people have said that the default transparency on RFC rainfall overlays is way darker than they like. Others may want to show the 12 hr rainfall RCF layer by default instead of the 24 hour layer. To save your preferences, use the Layer Controller in the top right corner of the map to turn on the layers that you want to see by default and adjust the opacity/transparency where applicable. Then click the ‘Save’ button on the Default Map Settings window.
Default Map Location and Zoom/Scale
Use this setting to make the map show a certain area when it opens. Simply zoom to that area and hit the save button in this section. You can always zoom out after the map loads if you want.
Minimum Zoom Out Thresholds
On earlier versions of RainPursuit, you had to zoom in further for the Gauges and Watersheds layer to show up on the map. The downside layers showing up when zoomed further out is clutter; sometimes there’s just way too much information crammed on the map. Now you can customize when layers become visible when you zoom into the map.
As you zoom into the map, the map’s “zoom level” number increases. By default, the map opens at zoom level 7. The Gauges and Secondary gauges become visible at zoom level 9. If you think that the gauges are too cluttered at that scale, move the slider for the gauges to the right to prevent the gauges from showing while zoomed out that far. Do the same for the other layers in this section and hit save.
Keep in mind these settings affect the amount of data that is transmitted to your device. You may want to move the sliders further to the right on mobile devices that have limited bandwidth. This also why RP restricts the minimum zooms levels to higher numbers for the watersheds and NWM streams. These layers, like the gauges, are ‘vectors’ that are comprised of a string (list) of map coordinates. If you were able to request the watershed boundaries when zoomed far out, that’s more data that has to be extracted from the RP database server, more data that consumes bandwidth and more computer resources on your device to render the coordinates. Plus, the map will look like a jumbled mess anyways. The National Water Model Streams are served directly from NOAA’s servers. RP restricts you from drawing this layer when zoomed out really far in order to “play nice” with their computer resources.
THE MAP LAYERS AUTOMATICALLY REFRESH
All of the map layers automatically refresh every 60 seconds. The last time that the map was redrawn is shown in the bottom left corner of the map.