Rain Gauges
These are the raindrop icons. The numbers under the raindrop represent the 6hr/12hr/24hr rainfall totals. Click the icon for detailed info. Note that the light blue rain drops represent the secondary gauges that are described below.
Data Source: All of the rain gauges come from NOAA's Hydrometeorological Automated Data System (HADS). The HADS site is a jackpot of very useful data, but it's difficult to navigate. Most of these rain gauges are updated every hour. Click on a rain gauge icon for more information about gauge update timing. The numbers (labels) under the raindrop icons represent the 6hr/12hr/24hr rainfall totals. Click the icon for detailed info.
Stream Gauges
The most recent stage and CFS reading (if that gauge records CFS) is labeled underneath these icons. The arrow icons show the trend of the stream flow: up means it's rising, down means it's dropping. Yeah, this idea was totally ripped off from boatingbeta.com -- Thanks, Chris! Click the icon for detailed info. Note that the gray arrow icons represent the secondary gauges that are described below.
These icons mean that:
 the stream is rising of falling less than 0.24"/hour, or holding steady
 the stream is rising more than 0.24"/hour but less than 2"/hour
 the stream is rising more than 2"/hour
 the stream is falling more than 0.24"/hour but less than 2"/hour
 the stream is falling more than 2"/hour
Data Source: Most of these are USGS Streamflow Gauges, but some come through HADS. The most recent stage and CFS reading (if that gauge records CFS) is labeled underneath these icons. For now, the icons show trends that are based on the last hour's worth of data.
Rain and Stream Gauges
Some gauge locations record both rain and stream flow info. The top numbers display the stage and CFS; the bottom numbers display the 6hr/12hr/24hr rainfall totals
StreamBeam Gauges

The paddlers who run SteamBeam.net have been installing and maintaining DIY streamflow gauges for several years. Their work is not only a very impressive technological accomplishment, it's also a major contribution to the paddling community. There are two ways that you can help them maintain their existing gauges and install new gauges: making a direct donation or becoming a StreamBeam member. Members get to vote on where the StreamBeam is installed! If you appreciate RainPursuit, please show it by supporting StreamBeam!
Stale Gauges
The rain and streamflow gauges record readings every 15 minutes. But most only transmit these recordings every hour. Then there's a bit of a lag between when the government servers receive the data and when RainPursuit acquires it. Gauges sometimes go offline for a variety of reasons. Here's how you know when a RainPursuit gauge has gone offline and is displalying old data:
 The yellow exclamation mark indicates that the gauge hasn't updated in the last 90 minutes.
 The red exclamation mark indicates that the gauge hasn't updated in the last 3 hours.
Same goes for streamflow gauges:
 The yellow exclamation mark indicates that the gauge hasn't updated in the last 90 minutes.
 The red exclamation mark indicates that the gauge hasn't updated in the last 3 hours.
Note that, at this time, these symbols with the exclamation marks do not apply to the "Secondary Gauges", which you can read about below. Many of those gauges update at very irregular intervals and that makes it hard to determine if they've gone offline or if they're operating on their normal, unpredictable schedule. But I'll probably try to implement some form of staleness notification for these gauges at some point in the future. Stay tuned.
Watershed Boundaries
Hydrologic Unit Codes were established by the USGS. The RP map features the two most detailed HUC levels: 10-digit and 12-digit, with the latter being the smallest watersheds that they derive. As you zoom into the map, the HUC-10 watersheds appear first and are outlined and labeled in blue. As you zoom in closer, the HUC-12 watersheds appear in green with green labels. I've found an error or two in the watershed names -- the Dunlap and Soak Creek watershed was incorrectly named Upper Whites Creek (or something like that). Please feel free to post any other errors on the Rain Pursuit Facebook Page or send me and email at alexzendel at hotmail dot com.
RFC Radar Accumulation Layers: Quantitative Precipitation Estimates
The accumulated rainfall shown in these layers are estimated by continuously summing snapshots of rain as detected by doppler radar. Definitely keep in mind that these layers are estimates. It's best to verify the amount of rain by looking for nearby rain gauges. More information can be found on this Wikipedia page.
River Forecast Centers (RFCs) monitor the Nation's river systems and provide real-time hydrologic forecasts and guidance for delivery to water resources cooperators and Weather Forecast Offices. The RFC QPE layers “produce the data using a multi-sensor approach utilizing NWS 88D radar estimates of precipitation, automated and manual precipitation gauges and satellite estimates of precipitation.” In other words, the precipitation gauges help ‘correct’ the estimates coming from radar snapshots. All of the RFC layers ending with ‘hr’ are updated every hour. All of the other layers are only updated once every 24 hours at Noon Greenwich Mean Time (UTC Time). The time that NOAA updated the layer being displayed on the map is shown in the bottom left corner of the map.
NEXRAD Radar
This is the live/current radar served up by NOAA. More about NEXRAD here.
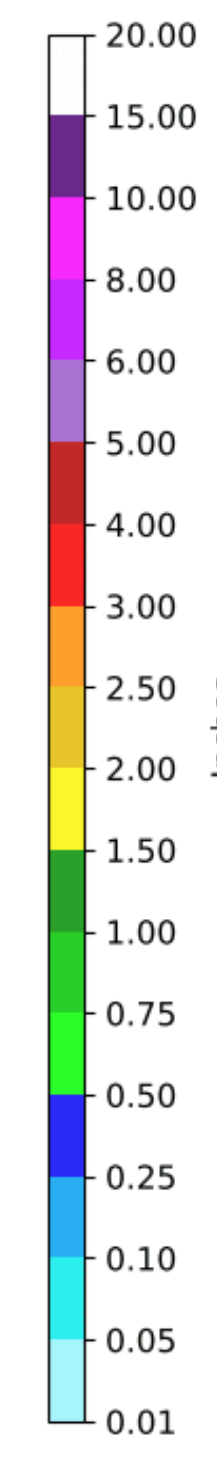
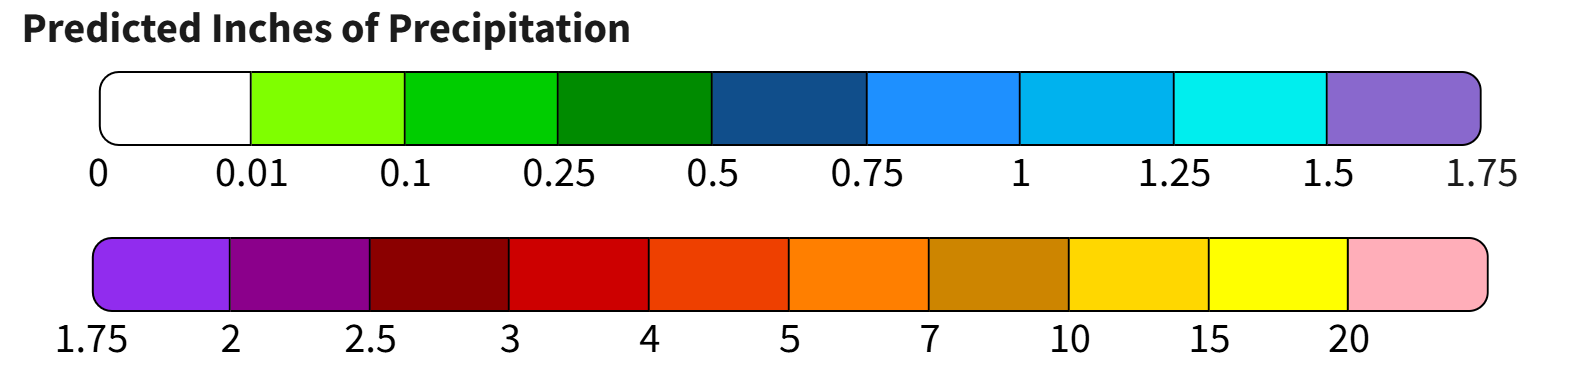
Quantitative Precipitation Forecasts (QPF)
These are the same map layers that are displayed on NOAA's QPF page. They come in two flavors: individual days and cumulative days. As the names imply, the individual day layers only display predicted precipitation for that day. Conversely, the cumulative layers show total predicted rainfall over a given period. As an example, the QPF 72 Hour Days 1-3 layer shows the sum of day 1, day 2, and day 3. Below is the legend for the QPF map layers:
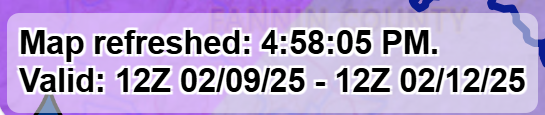
The time period that the precipitation forecast is valid for is displayed in the bottom left corner of the map:
What Rain Pursuit Can and Cannot Control
Your browser obtains the gauges and the watershed boundary map layers from the Rain Pursuit server. All of the other map layers come to your browser directly from different internet sources, mostly NOAA and USGS. This means that RP has no control over the colors (symbology) of those map layers. Similarly, there is nothing RP can do if those map layers go offline or fail to update.
Regarding the gauges map layer, the rainfall and streamflow data originate from NOAA and USGS, respectively. That data sometimes stops flowing. Stream gauges can be destroyed by floods. We temporarily lost many gauges after Helene struck. The communication systems that transmit rain and streamflow readings from the gauges can also fail. Finally, the USGS and NOAA webservers that RP obtains the data can also fail. When that happens, the yellow and red exclamation marks will appear (see above).