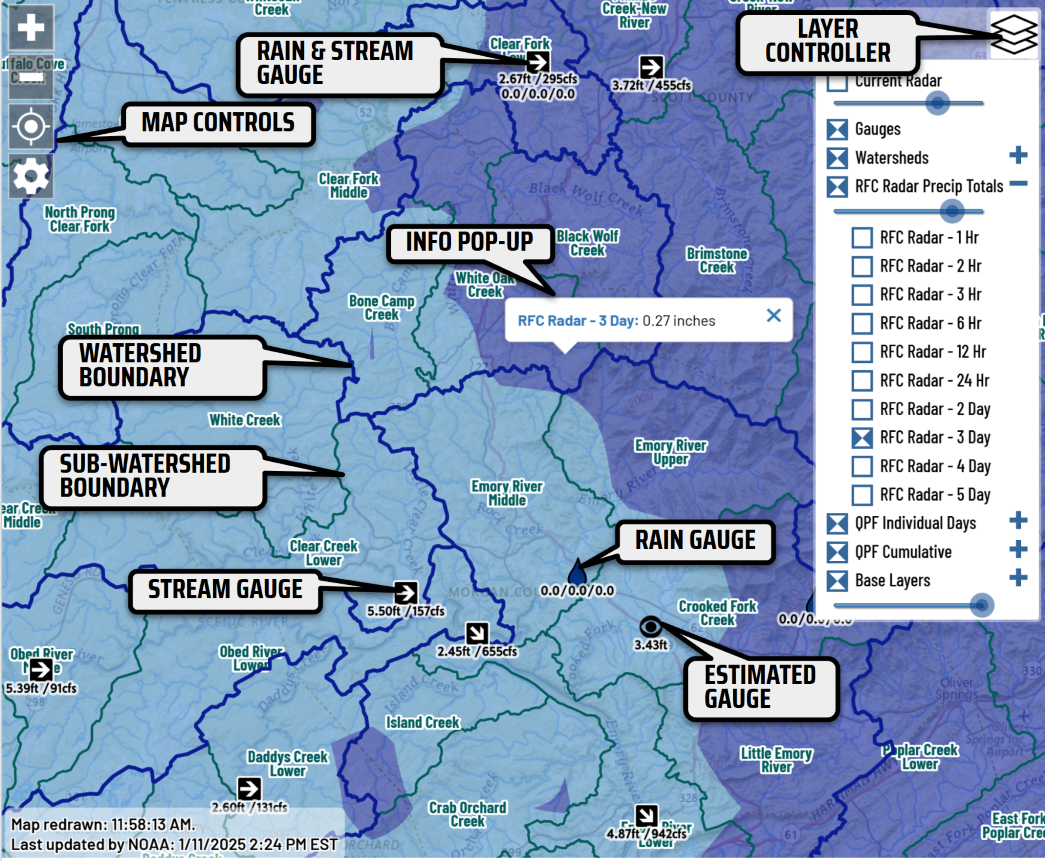
I created the RainPursuit.org map to serve as a one-stop, ‘dashboard’ web application to help paddlers locate optimum streamflows in the Southeast during and after rain events. This project was also an opportunity to expand my knowledge of open source geospatial software, web GIS and managing large datasets. The website is built on a 100% open source stack:
- Ubuntu 18.04 VPS hosted at Linode.com
- Apache web server / PHP server-side scripting
- PostgreSQL 11.4/ PostGIS 2.5 database
- OpenLayers 4.2 / Google Charts
Every 10 minutes, a cron job kicks off a PHP script that calls REST APIs to consume precipitation data from HADS (example response) and streamflow data from the USGS (example response) . Next, Python scripts are kicked off to obtain data from three other data sources, including the home-grown gauges hosted on StreamBeam.net (example response), Hamilton County, and a separate NOAA service (example response). After the freshly retrieved data is inserted into PostgreSQL tables, Postgres functions are initiated to calculate recent precipitation and streamflow trends. That trend data is then cached in the PostGIS table that stores gauge locations to support rapid queries and quick display.
The USGS HUC-12 watershed boundaries were reprojected to ‘web mercator’ to eliminate costly on-the-fly reprojection when users request that map layer. Because most smart phones were still using relatively slow 3G connections at the time, I used PostGIS’s ST_Simplify() and other PostGIS functions to reduce the number of extraneous vertices that will eventually be sent to the web browser via GeoJSON. Then I converted the HUC-12 polygons to lines to eliminate overlapping vertices while preserving the appearance of polygons.
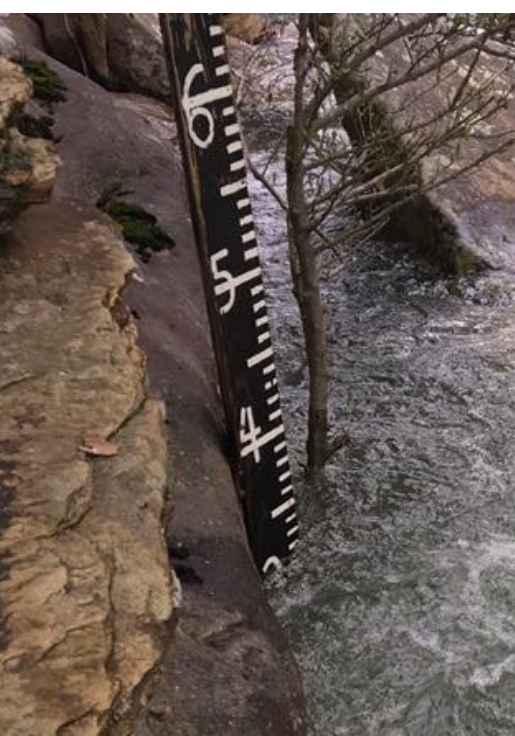
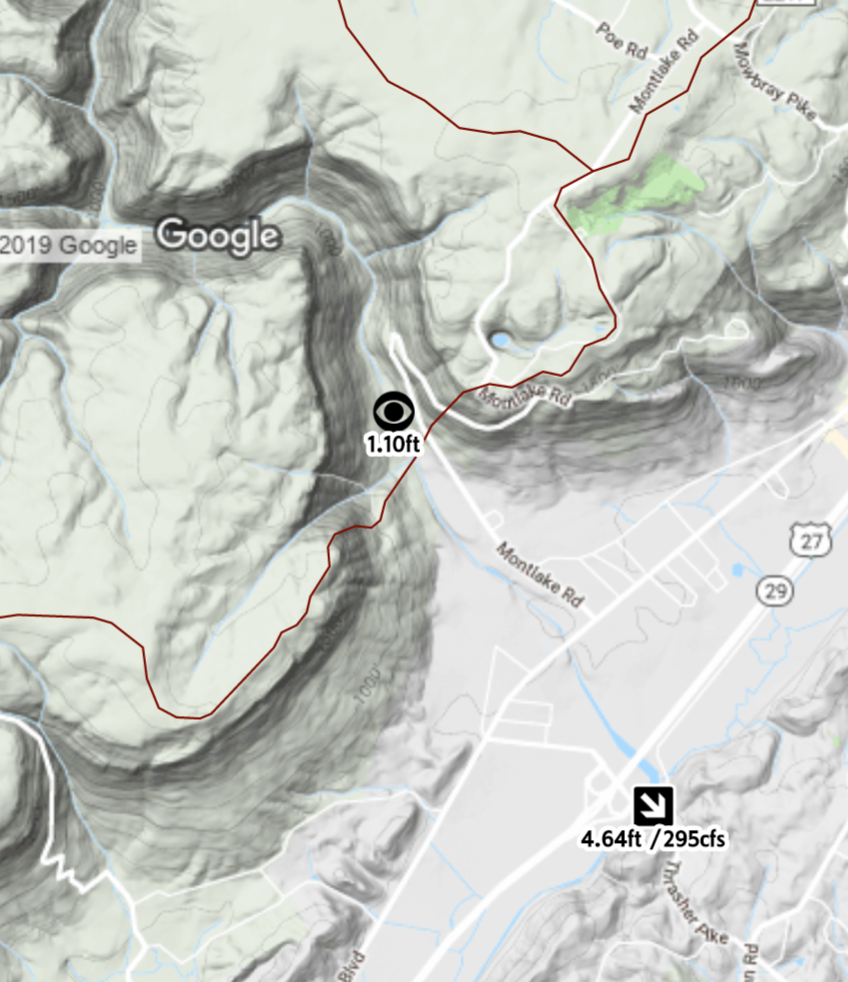
Each day, Rain Pursuit ingests approximately 40,000 rainfall readings and 67,000 streamflow readings. Although the web interfaces rarely query data that’s older than 7 days, I’ve used historic data to build correlations for streams that lack online gauges or to translate the online readings to other gauges that paddlers are more familiar with. Paddlers were very glad to see a new USGS gauge for the very popular North Chickamauga Creek, located north of Chattanooga, after the previous gauge had been discontinued years before. But nobody knew how the new USGS gauge readings translated to the familiar visual gauge at the take-out for the run. These days, boaters help each other by posting visual gauge readings on Facebook:
After the new USGS gauge had been online for a few months, I scoured Facebook for these posts and then queried the streamflow table for the USGS reading that was closest to that time. Since the paddlers’ gauge is only three miles upstream of the USGS gauge, I wasn’t surprised when a linear regression produced an R2 of 0.925 with a limited number of observations.
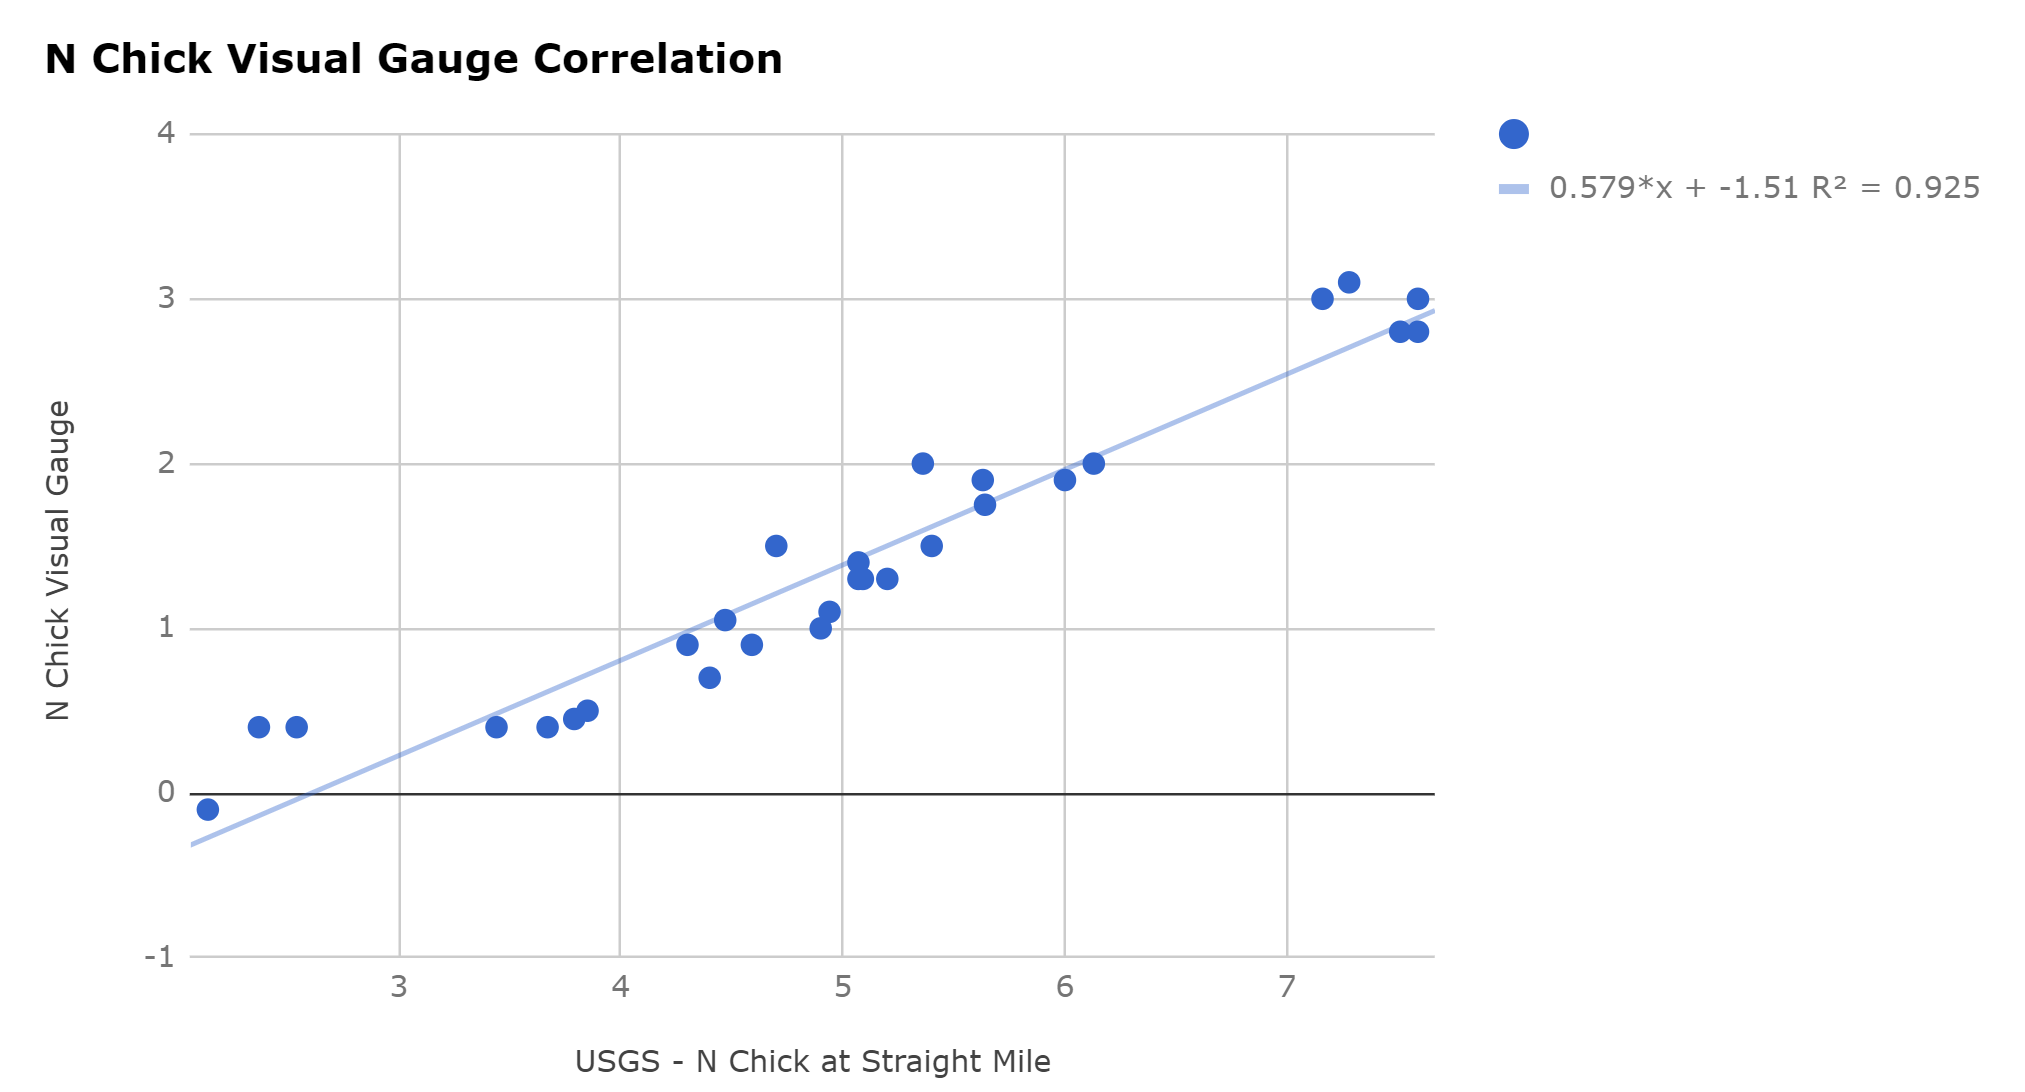
I then plugged the numbers from the resulting equation into a separate table. After new USGS readings come into the database, a PL/pgSQL function retrieves the equation and calculates the estimated visual gauge reading based on the most recent USGS reading. When users open the North Chickamauga Virtual Gauge Page, this equation is queried again and applied to every USGS reading as it is extracted from the database.
While I'm aware that far more advanced methods exist for estimating streamflow on ungauged streams, time and money constraints have prompted me to not pursue them as a part of RainPursuit.
Managing 267 Million Rows with Declarative Partitioning
When the table that stores the streamflow data began to exceed 12 million rows, the summary queries and chart generation began to show signs of sluggishness since the Rain Pursuit virtual private server runs on a total of 2GB of RAM, which is half of the RAM in most smart phones. To alleviate the poor query performance caused by the large table and indices, I implemented declarative partitioning based on date ranges of the stream and precipitation readings. As of August 2025, the database has amassed 106 million precipitation readings and 161 million streamflow readings. Thanks to Postgres's partitioning abilities - even on a virtual server with meager resources - the entire system often extracts 675 streamflow readings, sorted ascending by reading time, and packages them for display in the browser in less than 100 milliseconds.
Mixed Data Sources
While all resources on the RainPursuit server are based on FOSS4G software, the OpenLayers front end code does consume REST services that are published via ArcGIS Server. Both the Quantitative Precipitation Estimates and the Quantitative Precipitation Forecast originate from NOAA’s ArcGIS REST endpoint. The opposite situation is also possible. For example, if data volumes begin to exceed what's possible to store in an ArcGIS Online feature service, you could spin up an inexpensive hosted PostGIS server and top of it off with the lightweight pg_featureserv to serve large datasets.
Creating a Simple API
OpenLayers can consume GeoJSON URL end points and display the returned data on the map. It submits the current map extent (“bounding box”). Below is a sample web request to obtain the rain and streamflow gauge locations from the RainPursuit server:
The php script extracts the bounding box parameters from the URL query strings and passes them to the database. Thankfully, PostgreSQL and PostGIS can return data as GeoJSON, dramatically reducing the effort in building a long GeoJSON string in the php code. Below is an example of the database query that the php script executes:
SELECT field1, field2, st_asgeojson(st_transform(the_geom,3857)) AS geojson
FROM my_postgis_table
WHERE the_geom && ST_Transform(ST_MakeEnvelope($xmin,$ymin,$xmax,$ymax, 3857),4269))
The gauge locations are stored in longitude, latitude (decimal degrees),specifically the ESPG 4269. But many web-maps, especially those created in the decade of the 2010s, expect the map data to be in the “Web Mercator” projection (ESPG 3857). This query uses the PostGIS st_transforms function to project the latitude/latitude locations in the Web Mercator projection. Each gauge only has 2 coordinates, so reprojecting each gauge is not very computationally “expensive”. But projecting a long series of coordinates, as often occurs with lines and polygons, is better avoided. Because of that, the HUC boundaries that are displayed on the RainPursuit map are stored in their ‘target’ project: Web Mercator (ESPG 3857). These lines are accessed in a very similar manner with a bounding box:
in
The PostGIS query is substantially more simple since the lines don’t need to be projected:
SELECT st_asgeojson(geom) AS geojson FROM huc10_lines
WHERE huc10_lines.geom && ST_MakeEnvelope($xmin,$ymin,$xmas,$ymax, 3857);
When defining the bounding box for the extent of the spatial query, it’s necessary to inform PostGIS that the input coordinates are also in projection 3857.
Security sidenote: to prevent SQL Injection, data from an untrusted source, such as any user on the internet, should never be incorporated into a SQL string that is directly passed to a database server (PostGIS in this case). Instead, the SQL string should be defined as prepared statements with parameter placeholders such as $xmin above. Then these parameters are passed separately where they cannot be executed as dangerous SQL “verbs”, such as INSERT, UPDATE, DELETE or DROP.
Security sidenote 2: While all requests to the RainPursuit server are encrypted using HTTPS/TLS, this is a simple, read-only API that returns publicly-available data in an unrestricted manner. It does not contain any type of sensitive data, such as names, email addresses or financial information. APIs running in a more sensitive environment can be restricted using a variety of methods, such as requiring bearer tokens or users be signed-in (authenticated) in web frameworks such as ASP.net Core or Django. These web frameworks can implement role based access, pass an authenticated user id to row-level security implemented in PostgreSQL and impose rate-limiting/throttling to reduce abusive use to the API.