When I first began collecting crash data with our Bicycle and Pedestrian Planner, we had to sign oodles of paperwork to receive a few spreadsheets with a few hundred bicycle/pedestrian crash data from The Knoxville Police Department. Fast forward approximate 10 years, we were informed that we should obtain data from the Titan Database instead. The 'data dump' that they provided included every crash (including those that didn't involve bicycle nor pedestrians) for the past 10 years across the entire state. The hose that barely produced a trickle was now a full-blown fire hose blasting us in the face!
The data model for the Titan Database was fairly complex. Every crash could involve one or more vehicle or person, each vehicle could have more than one occupant, each driver could have taken multiple actions to avoid the crash, each person could have received multiple injuries, each person could or could not have used safety devices (seatbelt, helmet), each occupant could have been subjected to more than one alcohol/drug test, each driver could have been cited for one or more traffic violations, etc. Although we only needed crash data from the past 3 years in several counties, I had to import millions of rows before we could delete the irrelevant data (i.e., identify the crashes outside of our area of interest, then delete the corresponding rows from the vehicle table, then delete the persons, etc). The delete was pretty easy since I had used On Delete Cascade when defining the foreign keys / referential integrity: when I deleted the rows in the Crash table, the cascade deleted all of the vehicles, persons, etc. automatically. On the bright side we now had a more enriched dataset and could report on data beyond bicycle and pedestrian crashes.
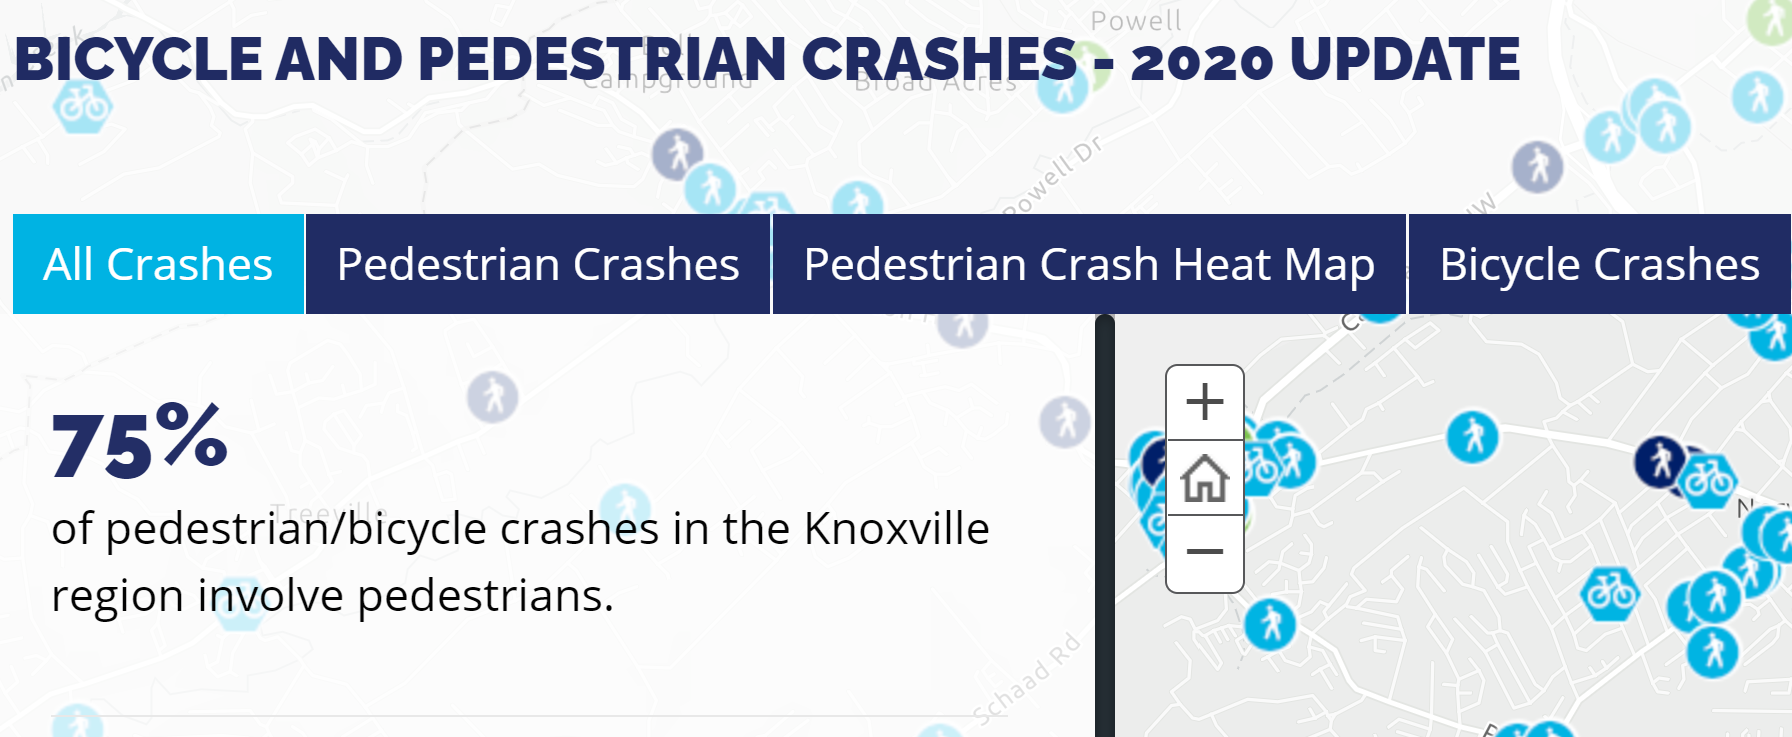
People say you should never reinvent the wheel. But what do you do when the wheel that you have doesn’t meet your specific needs? You modify it. The Bicycle and Pedestrian Crash Map, which was later superseded by the Life Altering Traffic Crash Map is built on top of ESRI’s “Map Series” Story Map. As I was nearing the completion of this project, our Greenways and Pedestrian Planner, Ellen Zavisca, asked, “Can we add aerial photos that the users can turn on and off? I think we should also add the boundaries of all of the cities in our planning region.” The following week, she thought of several additional layers that she wanted to add. To meet this last-minute request, I added the Toggle Layers button and the panel that it opens to control the additional map layers. It should be noted that our talented Webmaster/Graphic Designer Josh Anderson provided valuable feedback on the overall look of web page.